Tamil Nadu – Population Notes
Tamil Nadu – Population Notes
9. Tamil Nadu – Population
People of a country are the greatest assets for development. People living in an area together are known as population. The study of population is known as demography. People are considered as resources because of their ability to change available natural resources into value added products. Human potential, knowledge and energy are used for the betterment of individuals, the society and the nation. Every individual contributes to the nation’s development. Therefore, the size of population and its individual capacity in terms of education, health and work force decides the pace of national development. For this reason, people of the country should be nurtured in proper manner to maintain the quality and quantity.
Population of Tamil Nadu
As per 2011 Census, the population of Tamil Nadu was about 7,21,38,958 of which 3,61,58,871 was males and 3,59,80,087 was females. Tamil Nadu as a whole has 5.96% of the total national population (India).
The Census of India, a central governmental organization, is engaged in collecting, tabukating and publishing all statistics related to population, once in ten years.
| Demography indices
The crude birth rate – the annual number of live births per 1,000 people. The crude death rate – the annual number of deaths per 1,000 people. The infant mortality rate – the annual number of deaths of children less than 1 year old per 1,000 live births. The sex ratio-the number of females per 1,000 of males. Life expectancy –the number of years an individual at a given age would be expected to live at present mortality levels. |
Total fertility rate represents the numbers of children that would be born to a woman if she were to live to the end of her childbearing years and bear children in accordance with current age-specific fertility rates. The Total Fertility Rate of Tamil Nadu.
Birth and death rates for Tamil Nadu for the year 2006 is 15.9 and 7.6 per thousand population, respectively. Infant mortality rate has reached 37 to 1,000 live births by 2006.
Tamilnadu Administration Notes
Growth of population
From the bar diagram given, may be inferred that the population of Tamil Nadu has doubled over a period of 60 years from 1951 to 2011.
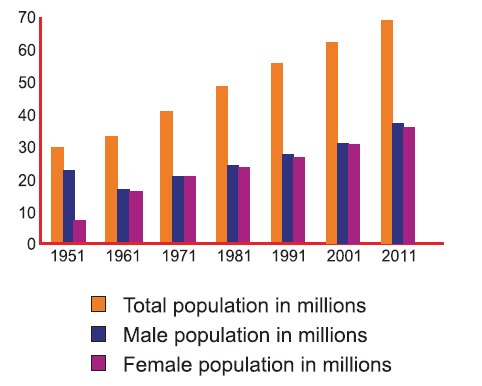
The difference between birth and death rates gives the natural increase of population of regions. When expressed in percentage it is known as the growth rate. The annual growth rate is 1.1%, which is lower than that of India.
When birth rate is continuously high, a nation has to provide education and health facilities for more number of children. Other environmental problems also increase with high population. Tamil Nadu has shown a considerable rate of reduction in growth rate in recent years.
Distribution of population
Chennai possesses the largest share of 6.4% of the total population of Tamil Nadu. This is followed by Coimbatore, Vellore and Salem districts. Perambalur has the least population of (0.078%).
Factors influencing the distribution of population
- Generally, plains with suitable climate support a huge population.
- Coastal plains with mild temperatures and good opportunities for economic activities support huge population.
- Job opportunities in large towns and cities attract both literates as well as illiterates.
- Dry regions generally support a small population.
- Mountainous regions with steep slopesn and forest cover support a small population as well.
In general, the variations in population among different regions are identified by population density. Density of population is a means of finding out the number of persons living in one unit area, which is generally expressed as persons per square kilometer. It gives an idea of how crowed a region is. The following table gives the density of population in Tamil Nadu, by districts of the states.
Table: Tamil Nadu: District wise density of population
| Number of persons per square km | Density | Districts (density is given in brackets) |
| Less than 400 | Low | Nilgiris(288), Ramanathapuram(320), Perambalur(323), Sivagangai(324), Dharmapuri(332), Pudukkottai(348), Dindigul(357), Krishnagiri(370), Karur(371), Thuthukkudi(378), Ariyalur(317), Erode(397), Thiruvannamalai(399) |
| 400 – 800 | Medium | Theni (433), Virudhunagar(454), Tirunelveli(458), Tiruppur(476), Villupuram(482), Namakkal(506), Thiruvarur(533), Tiruchirappalli(602), Vellore(646), Salem(663), Nagapattinam(668), Thanjavur(691), Cuddalore(702), Coimbatore(748). |
| Above 800 | High | Madurai(823), Kancheepuram(927), Thiruvallur(1049), Kanniyakumari(1106), Chennai(26903). |
From the table, it may be understood that eight districts exhibited high population density. Seventeen districts have medium densities and five districts fall under low population density. Chennai, the capital city, a centre for administration, education, industry, trade, commerce and recreation, has the highest density of population. Sivagangai has the lowest density of population.
Tamil Nadu Population Density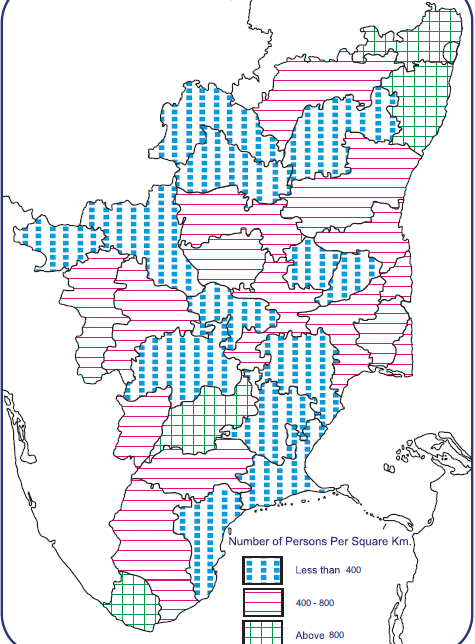
Composition of Population in Tamil Nadu
As per 2011 census, 37% of population in Tamil Nadu is below 20 years, 54% is between 20 and 60 years, and 9% is above 60 years.
Percentage of Schedule Castes and Schedule Tribes is 20% and 1.1% respectively.
In Tamil Nadu there are about 88% Hindus, 5.5% Muslims, 6% Christians and the rest are of religions such as Sikhs, Buddhist and Jains.
The state has a sex ratio of 996 women for 1000 men. The highest sex ratio is in Thuthukodi(1042) and the least is in Dharmapuri(946). Fifteen districts record more females than males.
In Tamil Nadu, 51.55% of the people live in rural areas and 48.45% of the population live in urban centres.
Literacy
The literacy in Tamil Nadu has greatly increased in the period 1951 to 2011. The overall literacy of Tamil Nadu is 80.09% Among the districts, Dharmapuri has the least literacy of 68.5% . Kanyakumari has the highest 91.75% of literates. Chennai, Thuthukudi and the Nilgris have 80% literates. Among the Schedule Castes and Schedule Tribes 55% and 35% of them are literates.
Tamil Nadu – Literacy rate
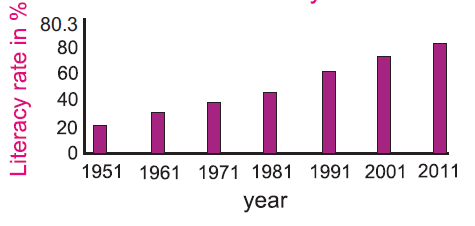
The state has considerably reduced the school dropouts. Education for all is the prime ambition of the government. Among men, 726 out of every 1000 are literates. Likewise among women 571 out of every 1000 are literates. Among the districts, Kanyakumari has the highest literacy rate with 803 for every thousand men and 758 for every thousand women.
Occupation
According to 2011 Census, the total number of workers in Tamil Nadu account for 44.67%; non-workers accounts for 55.33%. Among the workers, 41.5% work in the primary sector, followed by 27.7% in the secondary sector and 30.8% in the tertiary sector.
Classification of workers
It may be noticed from the table that agricultural workers are seen to, be reducing in number. Construction workers and tertiary workers are increasing year after year which indicates the trend of increasing urbanization in Tamil Nadu. In the year 2000, the unemployment rate for the state was 2.4%.
Tamil Nadu workers and Non-workers
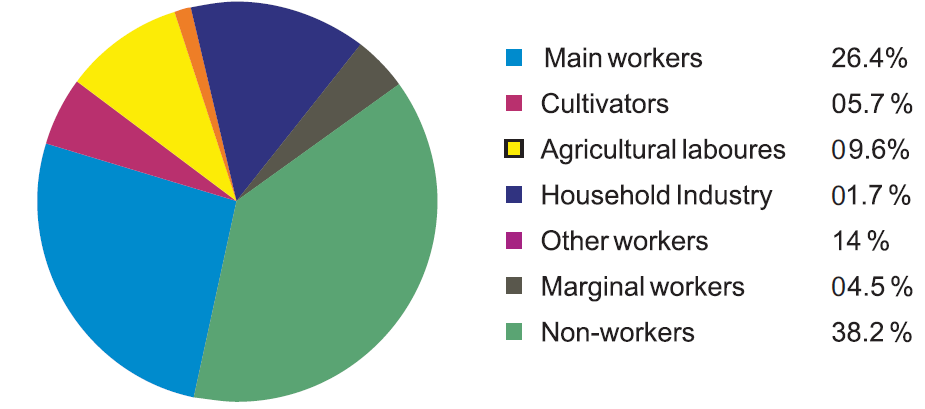
Table: Classification of Workers and Distribution
| Workers | 1961 (in%) | 1991(in %) | 2001(in %) |
| Cultivators | 42.0 | 25.0 | 18.4 |
| Agricultural labourers | 18.4 | 36.0 | 31.1 |
| Household, Industry, Manufacturing | 13.4 | 03.6 | 05.3 |
| Other workers | 26.2 | 35.0 | 45.2 |
Source: Tamil Nadu Human Development Report.
Women Development and their contribution to Economy
The potential of women should be realized and recognized for the well- being of any society and development of the nation. Tamil Nadu is a pioneer state which has encouraged the empowerment of women.
| Former UN Secretary General Kofi Annan has stated: “Gender equality is more than a goal in itself. It is a precondition for meeting the challenge of reducing poverty, promoting sustainable development and building good governance”.
|

Women empowerment includes:
- Women’s sense of self-worth
- Right to seek and decide upon choices;
- Right to have access to opportunities and resources; and
- Right to have control on their lives both within and outside of their homes.
Strategies Adopted by Government of Tamil Nadu for Women Empowerment
Tamil Nadu Government has implemented several welfare schemes for women empowerment.
In order to empower women, the Science City has been organizing Entrepreneurship Development Programme(EDP) and Entrepreneurship Awareness Programme(EAP) to bring out the talents of women and to make them prove their potential.
A Self – Help Group(SHG) is a group of women, organized for eradication of poverty. They agree to save regularly and convert their savings into a common fund known as the Group Corpus. The members of the group use this common fund through a common management. In Tamil Nadu the SHGs were started in 1989 in Dharmapuri district. At present 1,40,000 groups are functioning with 2.383 million members. Tamil Nadu Corporation for Development of Women Ltd arranges credit assistance for the successful groups through various schemes implemented by State as well as Central Government. Tamil Nadu ranks first in witnessing economic well-being of the people involved in such SHGs.

Human resource management
Since human resources are the most valuable of the resources of the earth, the people must be carefully managed so that everyone on the earth live peacefully. Human resource management aims at developing personal qualities in an individual so that he or she may contribute in a healthier manner for the national and world peace.